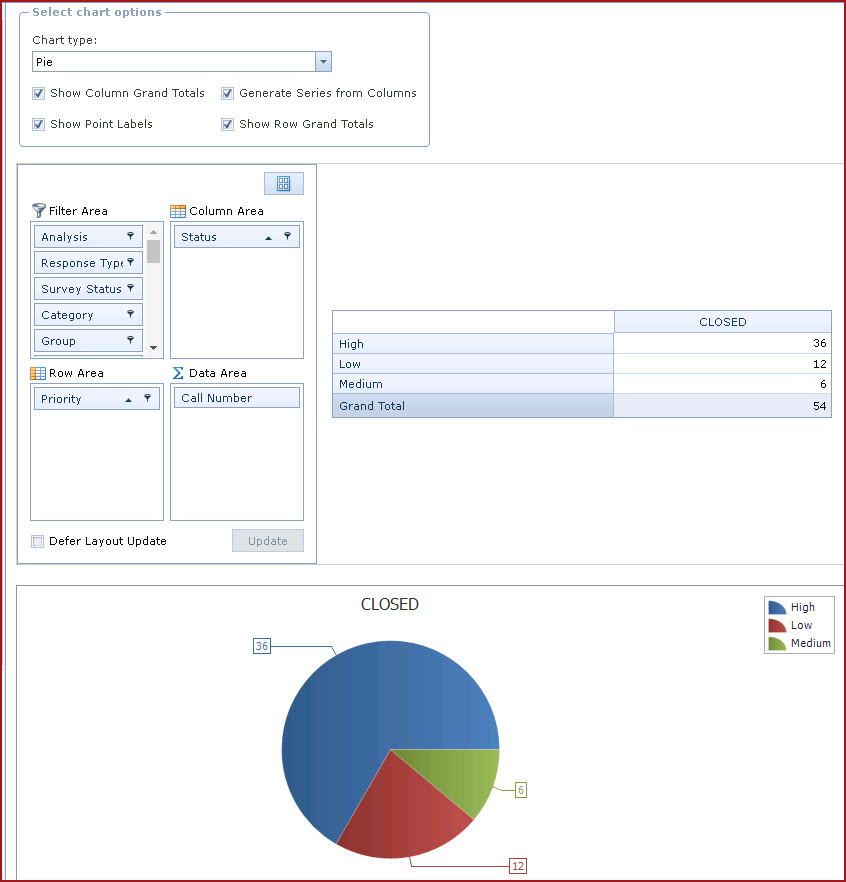
Survey Analysis
is used to extract charts and illustrations about the helpdesk survey
responses.
Steps for Analysis
-
Select the Chart Type
-
Enable the required details for the
chart.
-
Update the "Row Area", "Column Area" and "Data Area" with
the available filters under the "Filter Area".
-
Row and Column Areas will be the row and column labels on
the report.
-
Data Area will contain the data selected for
analysis.
-
The content of the chart will be represented in a table
format.
Figure 1: Survey Analysis